The Top Streaming Shows in 2023 - Part II: The Rest of the Data
EntStrategyGuy’s 2023 Streaming Viewership Recap
(Welcome to the Entertainment Strategy Guy, a newsletter on the entertainment industry and business strategy. I write a weekly Streaming Ratings Report and a bi-weekly strategy column, along with occasional deep dives into other topics, like today’s article. Please subscribe.)
Yesterday, I wrote over over 2K words just on Nielsen’s weekly top ten lists and the top TV shows in America. Today, we have another 2K words on the rest of the streaming ratings data sources, including...
Nielsen’s 2023 “Streaming Unwrapped” report (their annual rankings list)
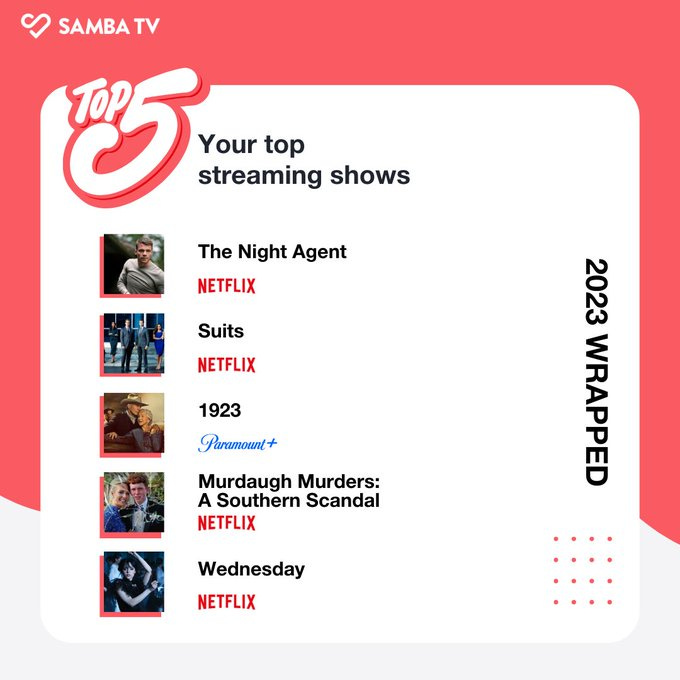
Samba TV’s 2023 Wrapped Top Five Lists
Samba TV’s weekly streaming charts
Showlabs by Plum Research’s 2023 Wrapped Top Five Lists
Just Watch’s Top Ten List
TV Time 2023 weekly charts
IMDb’s Best of 2023 list
Nielsen’s Top Ten Linear shows.
As I’ve written before, my goal is to run my own version of a “poll of polls” for streaming ratings; I want to incorporate multiple data sources to account for each individual analytics company’s potential biases.1 So get ready for 20 more charts, tables and graphs on what the top TV shows in 2023 were, starting with a topic I neglected in my first article…
Let’s Talk Kids and Family TV Shows
Yesterday, I completely ignored kids viewership, mainly because most kids TV shows don’t make the charts,2 so comparing them to adult/primetime titles doesn’t make a lot of sense. But we shouldn’t ignore the two monster kids shows that drive TONS and TONS of viewing.
Those two shows? Bluey and Cocomelon. Here’s every kids or family title, by viewing by season release in 2023.
(As a reminder, I color code my bar charts by streamer, with the key down below each chart.)
I won’t lie, knowing how often Cocomelon makes the charts, I was surprised that Bluey ended up passing it as the most viewed kids show in 2023. I think Bluey has more appeal for adults and slightly older kids, while also appealing to the preschool set, giving it slightly broader reach.3 The annual data backs this up.
Gabby’s Dollhouse is Netflix’s biggest original kids show, and the annual data backs that up. So let’s get onto that…
Nielsen Annual Top Shows List
Originals
As I mentioned last Friday, each year, Nielsen publishes a “Streaming Unwrapped” report for the top shows and films for all of 2023. I love this report, but it has its own biases. Mainly, the time period. TV shows that come out earlier in the year tend do better, since they had more time (often months and months) to rack up more viewership. But it’s still a fun data cut (more data is always better) and there’s some good insights to be divined.
Let’s start with Nielsen’s Original TV shows chart list:
Some Thoughts:
Congrats to Ted Lasso! Now, this “win” generated some pushback, as some observers couldn’t believe that a show on the smallest major streamer could win the prize. That said, this is the biggest, most popular show on Apple TV+ (and the most suggested to new users), so whenever someone signs up for Apple TV+ (or signs in to their free trial, which Apple tosses out to new customers constantly). It also has three seasons for new Apple TV+ subscribers to watch. And it’s not a huge outlier, since season two made the charts back in 2021:
Instead, I’d argue that this success is a dual-edged sword for Apple. A lot of people (including me, at times) say, “Well, Apple TV+ is tiny, so that’s why this or that show failed,” but look at Ted Lasso: they have the power to make hits. Going forward, if a show isn’t a hit, that excuse carries less weight now, right?
Speaking of the Nielsen annual charts over time, it looks like the hit shows in 2023 weren’t as big as past years. One way to show this is how many shows we had over 40 million hours viewed in a single week, my unofficial definition for a blockbuster TV show (at least for binge-released Netflix shows). As you can see, 2023 was down compared to 2022:
Virgin River is quietly a big hit for Netflix. Can I quantify “quietly”? Yeah, I can: The Changeling (which came out the same week as Virgin River this past fall) has over thirty reviews according to Metacritic. Virgin River has four. And it’s on season 4. This is a great example of what sort of TV shows the media likes covering versus what most Americans like to actually watch.
The fourth most popular show on streaming doesn’t even have enough reviews to get a Metacritic score!
One of the reasons I enjoy looking back on 2023 as a whole is that it reminds you of some TV shows you had forgotten about. Like The Night Agent. Oh yeah, that show was big, and even though it’s a Sony co-production, it will likely be a future tentpole for Netflix.
As the charts above show, when it comes to where top shows stream, Netflix dominates. As I mentioned last time, though it looks like Netflix’s share is decreasing over time, but not by much. Since Nielsen only released ten data points instead of fifteen this year, it’s hard to draw too much from this change.
Since Nielsen dropped from fifteen shows to ten shows, we don’t know if that impacted the percentage comparison since it isn’t the same show count. But if you want a negative Netflix take, you can see that their share of shows by “ownership”—as in who distributes and controls a show—declined compared to 2022:
Acquired
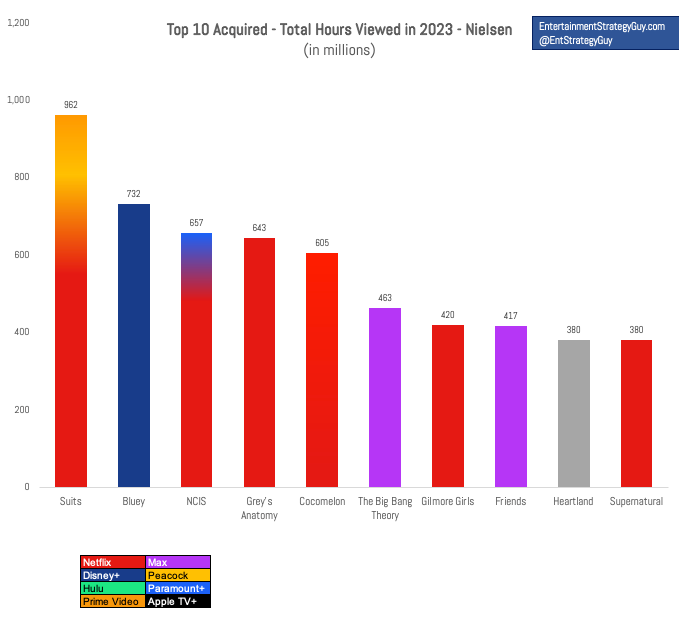
Again, Nielsen divides their analysis between originals that come to streaming first (Originals), and shows that stream or air first somewhere else first (Acquired). This is probably the most useful annual list Nielsen puts out, since it tells us exactly how much viewership these shows pulled in throughout the year, even if they missed a week or two on the charts:
(As a reminder, I’ve begun using a “gradient” fill on streaming shows that stream on two or more streamers. So, for example, NCIS is both red for Netflix and lighter blue for Paramount+. I do adjust the shade for a rough split of streaming too, so Netflix gets most of the viewership credit in this case. If a show streams in four or more places, I color it grey.)4
Some Thoughts:
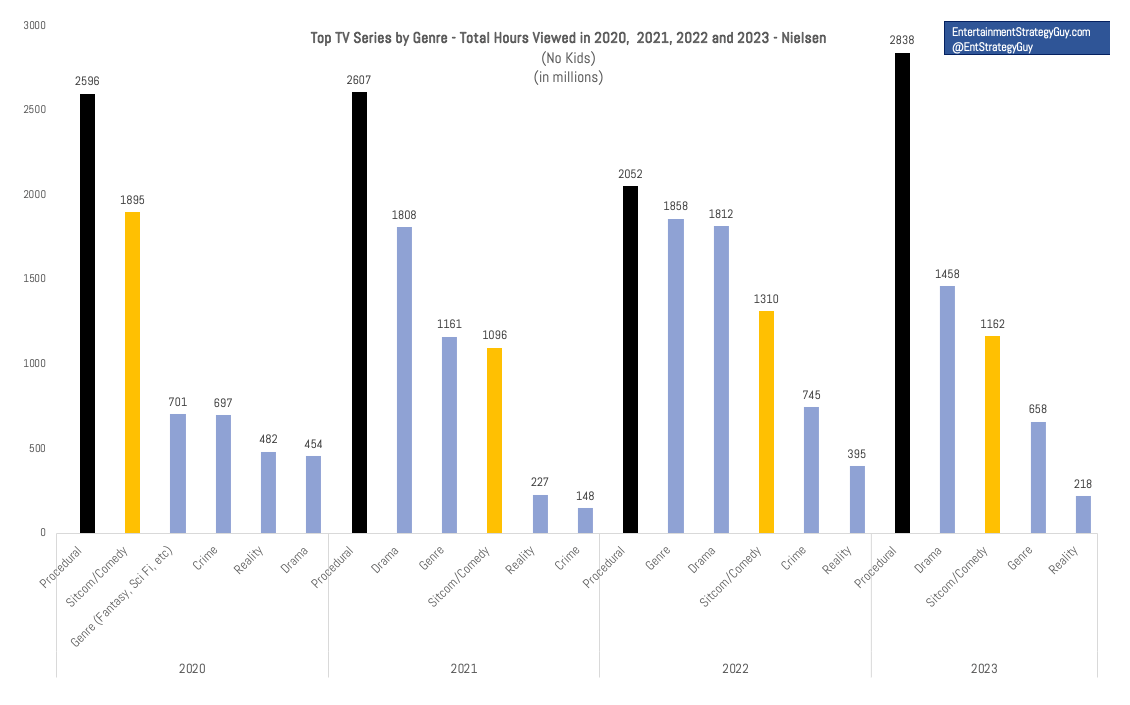
Looking across both originals and acquired TV shows, procedurals do very well in this metric. Here’s the most popular TV show genres by year, including both originals and acquired TV shows:
Procedurals only seem to be getting more popular! This is partially related to the Suits phenomenon, but NCIS is also really popular.
We’re seeing more and more shows on the acquired charts showing up on multiple streamers:
We can also look at who owns what TV show, and again you can see that, for all their dominance as a streamer, the owners of the top shows on streaming really are a diverse lot:
Samba TV Charts in 2023
Okay, that’s a lot of Nielsen data, so time to move on to different data sources that also looked at the top shows in 2023. Samba TV measures (and, beneficially, publicly shares data on) unique households, which provides a fascinating comparison to Nielsen’s minutes viewed charts.
Here’s their weekly top ten charts by “score”, which is reverse of the rank. (10 points for first, 9 points for second and so on.) Remember: this is only from June on in 2023, and I look forward to having a full year of data to analyze in 2025…
Some Notes:
Netflix’s The Night Agent edged out Suits—which was easily the biggest show by hours viewed—in terms of unique viewers. That’s why I prefer using both “total hours viewed” and “unique viewers/households” when possible.
Paramount+’s 1923 is the pleasant surprise here, though it probably has the same dynamic going on as Ted Lasso. I bet that 1923 is one of the first TV shows that most Paramount+ subscribers put on when they subscribe to Paramount+. It also came out at the very end of 2022 (weekly released), giving it a full year to accumulate viewership.
Congrats to Murdaugh Murders: A Southern Scandal, which was Netflix and streaming’s biggest true crime docu-series in 2023. (True crime docu-series don’t show up too often at the tops of the charts, but they have much lower budgets.)
You can see the time frame bias in the year-end recap by looking at Wednesday, which came out in November of 2022 as well. We covered it a lot last year in these articles, but Wednesday was a juggernaut and the second season should be similarly big. In fact, the season twos “Squid Game (due in late 2024) versus Wednesday (due in first half of 2025)” showdown should be fun.
If you want to see the difference between binge versus weekly shows, just look at these charts. Seven of the top eight shows are non-Netflix shows, on a chart Netflix dominates each week. That shows how a smart weekly release can help extend a show’s lifespan on a streamer, and keep customers coming back.
Showlabs by Plum Research Top Five Charts- Annual
Like Samba TV, Showlabs by Plum Research also tracks “unique viewers”, again making it a useful contrast to Nielsen. Also, as a reminder, both Samba TV and Showlabs ran their annual reports through November, not December.
Here’s PlumResearch’s 2023 Wrapped results:
Some Notes:
The Last of Us put up monster numbers, and if it had been a streaming “Original” likely would have shown up on a few more charts. Even with that, it was the ninth biggest overall show on the acquired Nielsen weekly charts, but Showlabs has it even bigger throughout the year.
Showlabs has the least “Netflix-centric” charts among the streaming viewership charts, with Prime Video getting two spots, Disney one, and Max the top prize. Reacher was bigger than either The Summer I Turned Pretty or Invincible, but it came out really late in the year, likely hurting it on this data cut.
Oh, adult animation. I haven’t mentioned it yet, but Invincible is animated, for adults and it made the Showlabs charts, but missed the Nielsen and Samba TV charts mentioned above. By my math, not a single animated series made the top 50 debut/returning series in 2023. Again, animation can deliver a good bang for the buck, but it doesn’t have as high of a ceiling as live-action. (Yes, this is a nuanced take that gets lost in a lot of headlines.)
Yes, I do wish Samba TV and Showlabs had provided us more than 5 shows! C’mon guys, give us at least ten!
TV Time - Weekly
TV Time released a poll for their year-end recap (I don’t love user polls), but since I track TV Time’s charts each week, I can just show you that look.
Reminder, this is an interest metric, meaning they chart how many of their users are interested in any given show.
Netflix struggles on these charts, but I’d argue that’s just because they’re the “default” streamer for many cord-cutters. Still, if you’re Disney, Apple or Paramount+, you like these charts. After all, Netflix did better on these charts in 2022. Since I’ve been tracking this chart for multiple years, let’s go ahead and compare the top 2022 TV shows to the top 2023 shows.
Some Thoughts:
How I Met Your Father’s strong interest never translated into strong ratings, since Hulu cancelled that show last year.
Just Watch
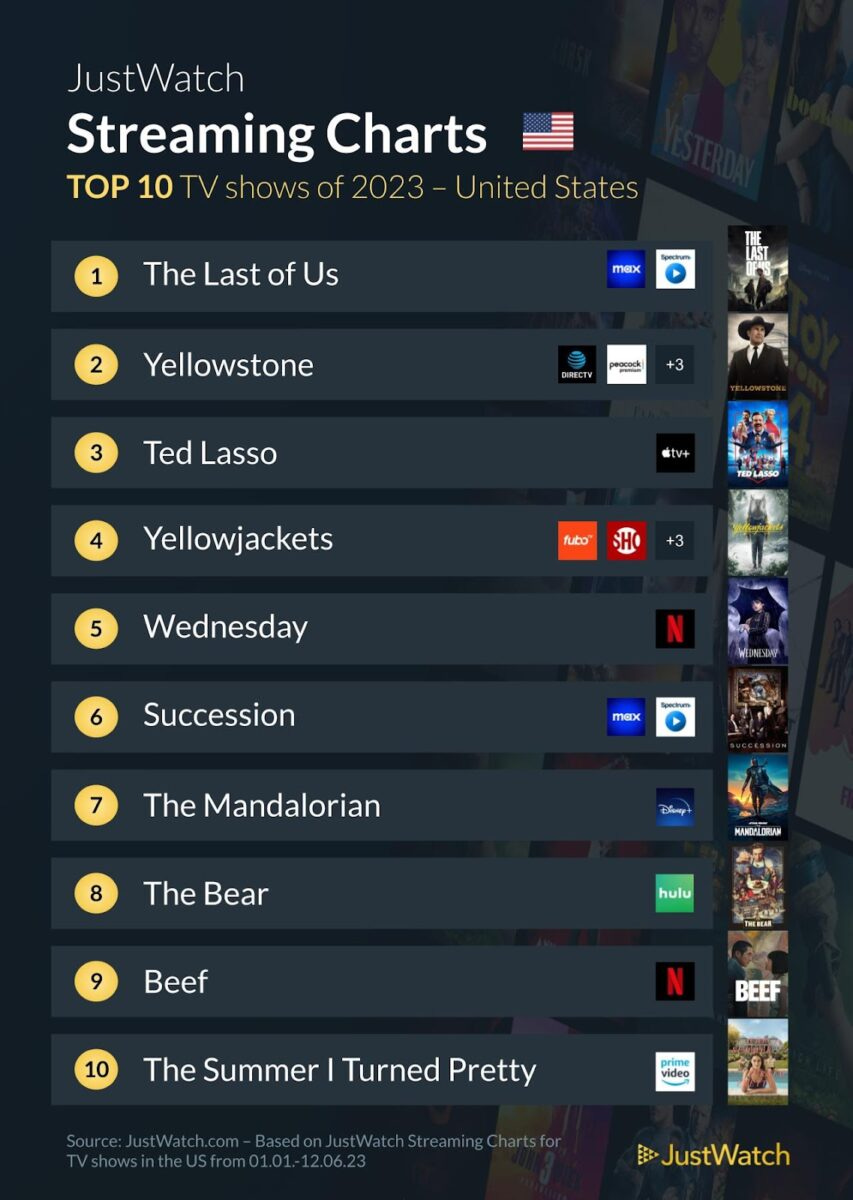
Here’s Just Watch’s annual ranking. Remember that, like TV Time, this is an interest metric.
Some Thoughts:
Since this list includes linear shows, you can see how big Yellowstone, The Last of US, and other linear/cable TV shows are compared to streaming shows. Honestly, I wonder, if Nielsen included streaming viewership compared to linear viewership, how much the narratives in Hollywood would have changed over the years.
Shout out to The Bear and Beef, which made the top ten of this chart.
IMDb “Best of 2023”
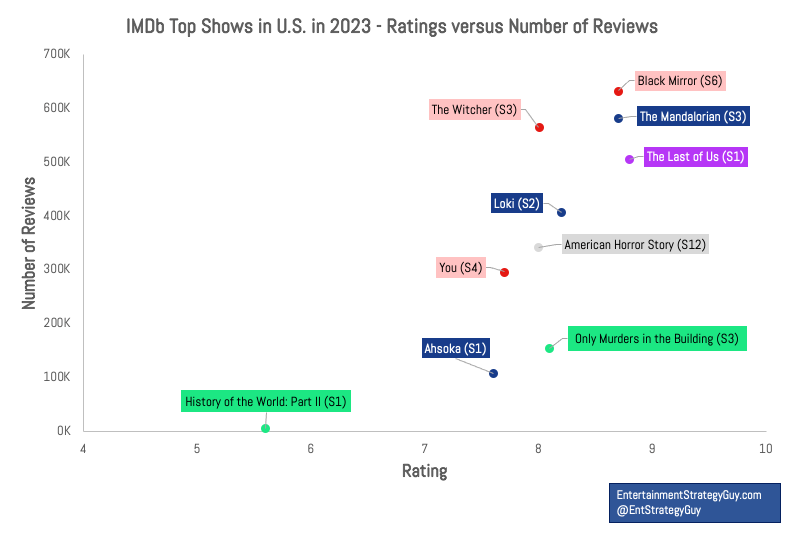
IMDb released a ‘Best of” recap focused on page views (which they didn’t share publicly) so here’s that list, along with the reviews for the show and their number of reviews.
Some Thoughts:
As I often mention with IMDb, there’s a clear skew on IMDb towards genre shows, hence why seven of the shows are sci-fi, horror or fantasy shows. This doesn’t mean that you can’t use IMDb to glean insights; it just means that you have to take this bias into account.
The big surprise is History of the World Part II! But looking at its reviews and ratings, yikes, It doesn’t belong on the list with these other shows.
Top Broadcast and Cable Shows
Unlike films—where box office really does matter for a feature film’s overall financial health and streaming ratings—broadcast, cable and streaming compete for viewers; they don’t complement each other. Usually a viewer will watch a show on streaming or broadcast, but not both. Still, as long as I’m dropping a ton of charts on you today, I may as well highlight the top TV shows of 2023 across all mediums, right?
So here’s the top shows on broadcast, converted from Nielsen’s average minute audience to total hours in first seven days after an episode airs:
Overall, broadcast still rivals streaming in terms of total hours viewed. I may visualize some linear charts in a future episode, but if I did “top telecasts”, football would obviously dominate the charts. Better than well, even. Also, yes CBS dominates.
On the other hand, cable viewing really has dipped over time, and the “series” on the top Nielsen chart were mostly specials, or reruns of Paramount+ Taylor Sheridan series.
Of course, many streaming analytics companies release almost no public data. Kudos to the ones who do!
Unlike kids films, which definitely do.
I’ve been playing around with an idea about Disney can right theatrical/feature film ship. Here’s one pitch: leverage their more popular animated shows from Disney Junior and Disney Channel, like Spidey and His Amazing Friends or Bluey, into slightly-cheaper feature films. What would a $40 million Spidey and his Friends film do in theaters? Or a $80 million films?
I also color Cocomelon as “non-exclusive”, even though it’s moved to only Netflix and YouTube. Nielsen classifies Cocomelon viewing as only Netflix in their charts, but I suspect some YouTube viewing slips in, hence two reds.


