(Welcome to my weekly streaming ratings report, the single best guide to what is popular in streaming TV and what isn’t. I’m the Entertainment Strategy Guy, a former streaming executive who now analyzes business strategy in the entertainment industry. If you were forwarded this email, please subscribe to get these insights each week.)
Just like last week’s streaming ratings report, this week’s report features a number of buzzy new TV shows, giving us lots to talk about (reminder, the week starting 19-June), but the real story—for me!—is data. We had a big new data update, and it’s exciting enough to get its own section in this report.
As a reminder, my goal has always been to use a variety of different sources of streaming ratings each week. And my preference among data sources is those reporting viewership, and reporting that viewership regularly. Viewership is the metric that drives everything else; ratings and interest metrics are also useful, but viewership is the goal.
The exciting news is that we get to onboard a new viewership metric from Samba TV! So we’ll start with that fun news, then talk about “shows that build buzz” (like The Bear), new shows like Secret Invasion and Catching Killers, the disappointing season two debut of And Just Like That…, all of this week’s flops, bombs and misses, Nielsen’s The Gauge, what streaming show is headed to broadcast, and more.
Oh, and if want even more EntStrategyGuy in your life, I made a few guest appearances this week:
I was quoted by Megan McArdle in The Washington Post on the economics of TV for her piece on the strikes.
I talked with Michael Beach on the CrossScreen media podcast about a few different topics, including Netflix subscribers, algorithms and the Average American viewer.
Lastly, I made my podcast debut on The Ankler's podcast, talking to Sean McNulty and Elaine Low about the strike, residuals, mergers and more.
Check ‘em out!
(Reminder: The streaming ratings report focuses on the U.S. market and compiles data from Nielsen’s weekly top ten viewership ranks, ShowLabs, TV Time trend data, Samba TV household viewership, company datecdotes, and Netflix hours viewed data, Google Trends, and IMDb to determine the most popular content. While most data points are current, Nielsen’s data covers the weeks of June 19th to June 25th.)
Data!!! Samba TV’s New Top Ten List: This I Can Use!
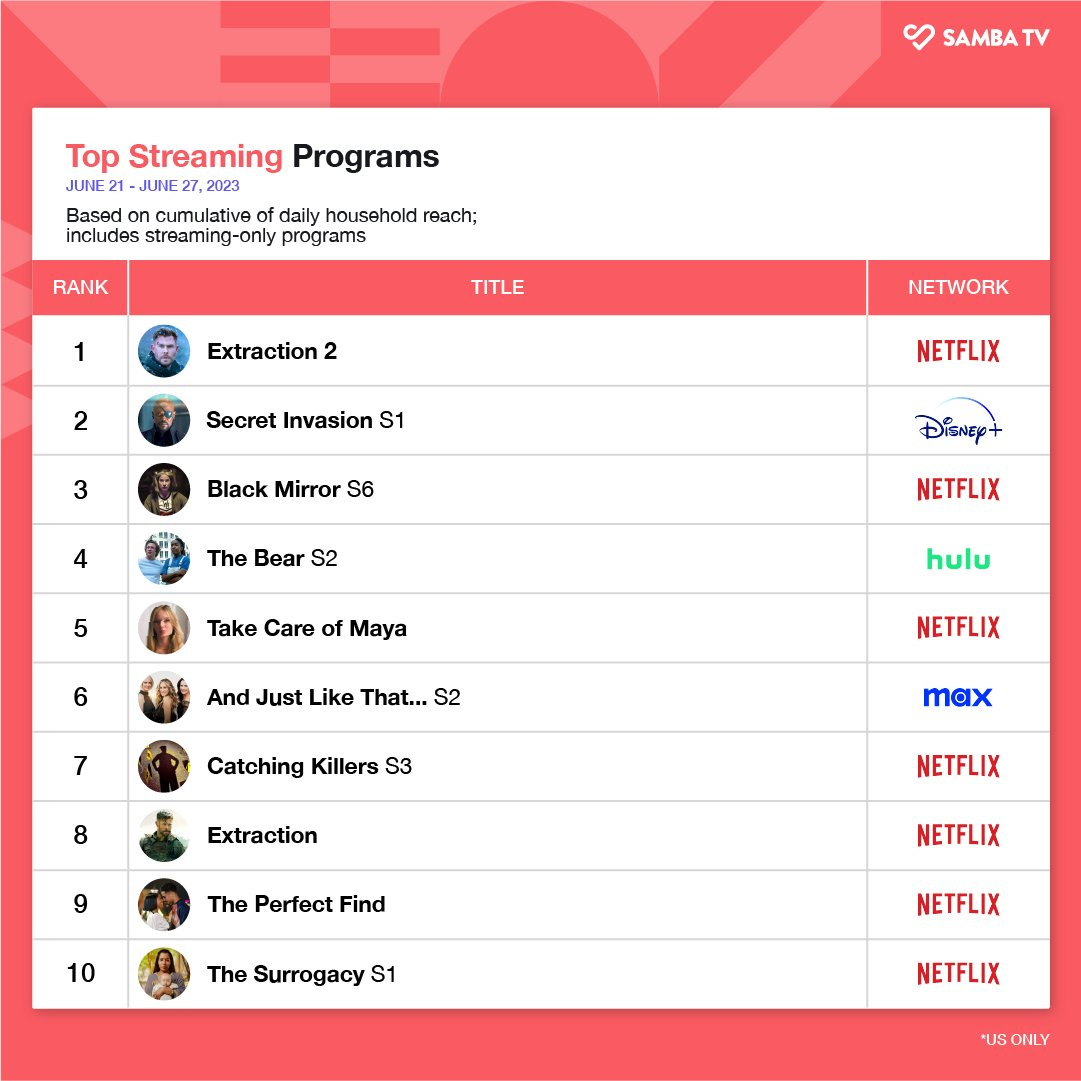
Here’s a fun data update you might not have noticed. If you scroll down each week to the bottom of this week’s report—meaning you’re a paid subscriber or have a very nice friend who forwards it to you for free—you know that I include Samba TV’s weekly top ten list of film and TV shows (which uses viewership by unique households.) From what I understand, Samba TV provides it to The Wrap exclusively, then usually publishes on their social platforms after that.1
Here’s this week’s chart:
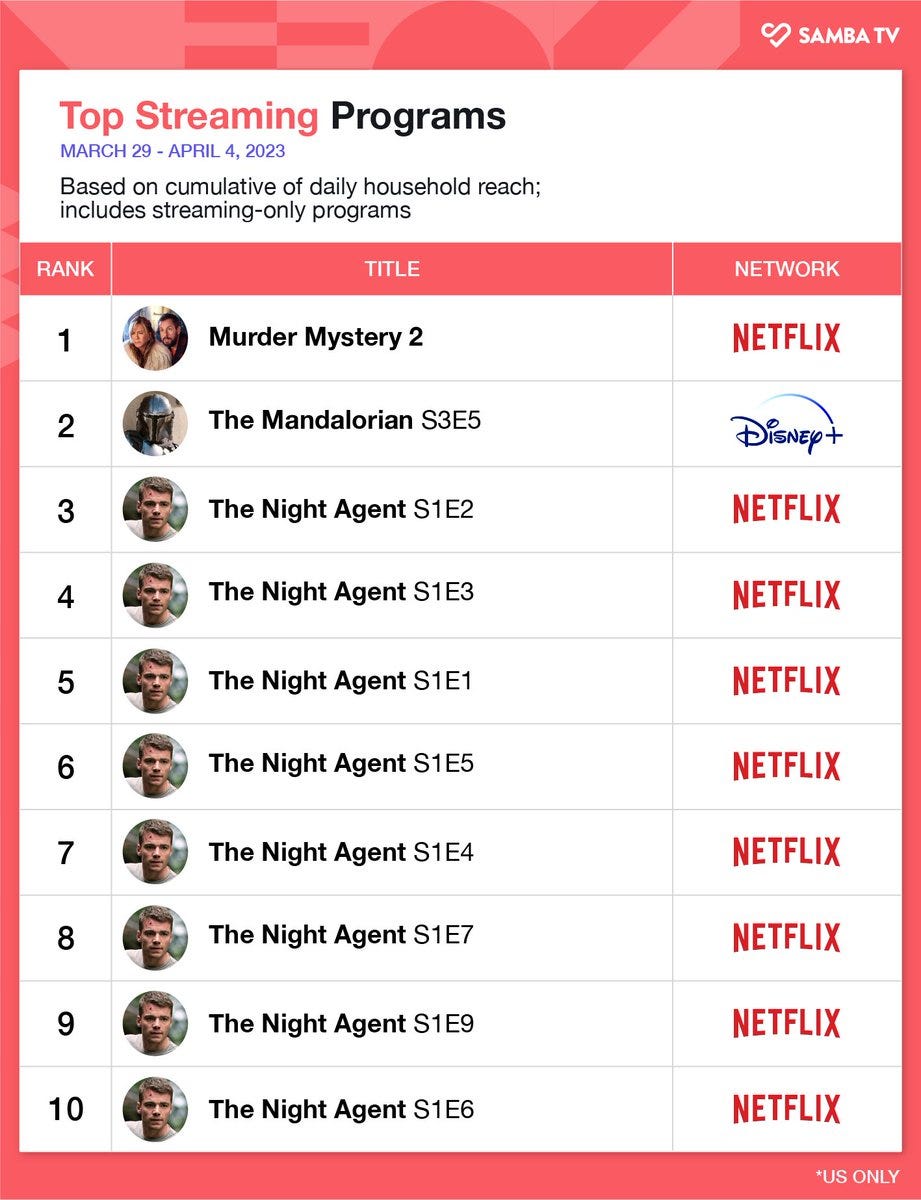
This is a bit of a change from the past. For example, here’s a sample chart from last March:
Notice the difference? Previously, Samba TV only provided unique viewers by episode. If a show was really popular—like The Night Agent—it was basically a top ten list for only one show. (It was even worse when Wednesday came out last November!)
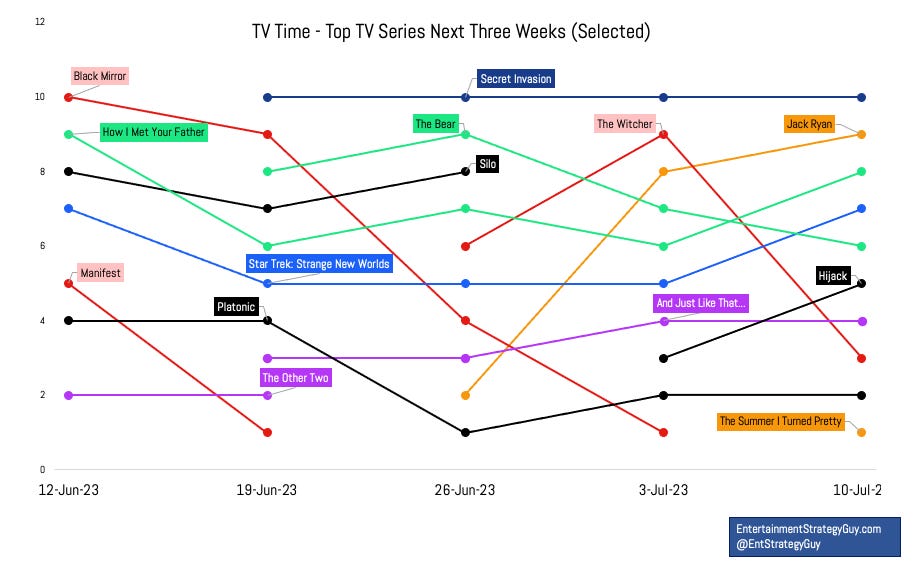
In May, Samba TV quietly shifted from sharing data on individual episodes to seasons, and I couldn’t be happier. Now that they’ve broken it out by season, this is a list I can use weekly, and I can make it look like my TV Time chart:
For example, this week we got a fun insight that The Kardashians is a top ten TV show according to Samba TV, even though it missed the Nielsen charts this week. My goal has always been to incorporate multiple data sources into this report to have a fuller picture of the ratings. Every streaming analytics company has their own biases, strengths and weaknesses. By averaging multiple sources together, we get a more accurate picture. (Yes, this is a similar method to what Nate Silver tries to do with election polls and polling averages.)
Hey, do you want some more fun insights I gleaned after inputting five weeks of Samba TV data into a database. Me too!
Netflix’s Our Planet, a dog not barking from last week, also made the charts. (I’d still count this as a miss.)
Disney+’s Secret invasion does a bit better on Samba TV then on the Nielsen rankings.
And Just Like That... missed the Nielsen charts this week, but it showed up here.
That said, it is important to understand the strengths and weaknesses of this new data set, and how I plan to use it:
Since Samba TV doesn’t provide actual numbers on this chart, the graph I’ll make will chart titles by position, similar to the TV Time charts I already make.
Unlike the TV Time charts, but like the Nielsen charts, Samba TV releases these charts after a three week or so delay, so the time frame when I publish them will be “backward-looking”, meaning the three weeks of data before the week I’m covering.
Samba TV uses “unique households” to put together their ratings. What’s better, that or minutes viewed? It’s a trick question; they’re both great. In fact, I like/prefer having different sources that measure different things in different ways. It provides a more holistic picture of the streaming landscape.2
By their very nature, these lists tend to be pretty Netflix heavy, especially since Netflix is the biggest streamer and these charts measure unique viewers.
Also, since they include movies and TV shows, there’s way more turnover than TV Time’s charts. For example, Avatar: The Way of Water only made the charts for one week, which feels low.
These charts start mid-week, which is different from TV Time and Nielsen. It kind of makes sense, to capture the weekend, but I also like having a week start on a Monday. In the end, it doesn’t really matter, but it’s something I’ll take into account going forward.
Now, if you pushed me...of course I still want more data! I’d love one top ten list for films and one for TV shows. And I’d love to have actual numbers attached.3 But I don’t want to get too greedy. This is a great start—specifically, moving away from individual episodes—and I’m glad to have this data.
Television - On Slow Growing Hits and The Bear’s Big Bow
Hollywood loves to celebrate any TV shows and films that can build an audience over time. Like The Shawshank Redemption. It wasn’t a hit in theaters, despite its Oscar nod, but it became one of the most beloved films of all time after countless replays on cable television. Or Breaking Bad; its first season averaged 1.5 million viewers; the finale had over ten million.
These shows and films give hope to any executive or producer whose film or TV show fails to open well. “Maybe we’ll be the next Shawhank Redemption!" they think. Lately, The Greatest Showman is the go-to example.
And it looks like we finally have a streaming example. Last summer, the formerly “FX-on-Hulu”-but-now-just-FX-branded The Bear missed the Nielsen ratings for the first two weeks after it originally came out, but three weeks in, it finally made the charts at 5.8 million hours. This summer, its binge-released second season, which came out on Thursday 22-June, debuted in second place on the Nielsen charts with 14.2 million hours.
That’s a big bump! I’m not sure we’ve ever seen growth like this before in the “Streaming Ratings Era”, post 2020. Since this report is only a little over two years old—and streaming ratings aren’t much older than that—we really just don’t have a lot of examples of shows going from “no ratings” to “second on the charts”. The best I could find is Emily in Paris; it barely made the charts in 2020 (back when Nielsen only released one top ten list) but then its second season is ranked 18th overall among second seasons. The rest of the shows on the top of the second season charts either had:
A popular first season
2. Didn’t have ratings data (because they came our before 2020), but were likely still big.
So let’s get the first question out of the way...was I wrong last summer? I thought I was getting a bit over-hyped by some people, especially since a lot of critics were calling it the “hit of the summer”, but as I noted at the time:
“As for The Bear, it’s officially Hulu’s best dramedy in terms of Nielsen rankings. Of course, that’s not a very high bar, since it’s also Hulu’s first dramedy to make the Nielsen rankings. Of all the season one debuts in my data set, through two weeks—remember it was released the week before—it ranks 110th place out of 144 in my data set. It also has a great IMDb score, with an 8.5 on 17K reviews.”
That feels like a solid description of the data we had then. And again a show can start out slow and build an audience. Which is what The Bear did last year, by making the Nielsen charts in its third week and having a very solid run on the TV Time charts; there was some evidence The Bear could have a big second season...but I wouldn’t have predicted that based on the data alone.
In context, The Bear is a good-to-great hit for Hulu. It’s the single biggest week for a Hulu show since The Handmaid’s Tale’s third season, which debuted at 17.3 million hours. It has absolutely elite IMDb reviews: 8.5 on 115K reviews. That’s crazy good. Even Hulu has acknowledged the growth with a vague datecdote, nothing that season two grew viewership 70% compared to last year. (Hulu, since Nielsen releases ratings data, why not just say how well it did with exact numbers?)
That said, those Nielsen numbers aren’t elite. At only 14 million hours, season two ranks 21st out of 73 second seasons in my Nielsen data set. Plus, since it was binge-released, The Bear will likely fall off the charts in a few weeks.
The interest metrics match the Nielsen viewership. The Bear has made Samba TV’s weekly charts as well, but it was in fourth place and seventh place. On TV Time, The Bear has made the charts for four weeks so far, getting as high as 2nd place.
Still, this is mostly great news for Hulu, which really needed one of its dramedies to really hit it out of the park. Despite this success, though, I still think Hulu makes too many depressing TV shows overall. Though The Bear is Hulu’s biggest hit dramedy, they’ve made a ton of them and most of them totally failed to garner any sort of an audience, like Life & Beth, Flesichman is in Trouble, and so many more.
But you want to know what worries me most about writing about The Bear’s big rebound?
So many streaming executives are going to take the wrong lesson from it!
Please, please, please, streaming executive, don’t assume your under-performing show is the next The Bear!
This reminds me of the Seinfeld analogy. Development execs love to mention how Seinfeld “tested poorly” with audiences, but later became a smash hit. It basically is meant to justify never using any testing or data since, “Hey you never know what will become a hit!”
Unfortunately, yeah, we kind of do. Two plus years into the streaming ratings game, this is the only show that I can think of that had explosive growth like this. The danger is over-learning the lesson of The Bear, that everyone thinks that their buzzy TV show with Emmy noms and critical acclaim is the next Breaking Bad or The Bear when, most of the time, poorly-rated shows just keep having poor ratings.
So if you have a show that you worked on or on your streamer that has bad ratings, remember, its next season it will likely still have bad ratings. Big rebounds are rare!
But not unheard of. My guess for what show has this sort of growth next (To coin a phrase that probably won’t catch on, “to pull a The Bear” but that sounds clunky) is Andor. That show has an 8.4 on 143K reviews, which is very similar to The Bear plus it’s ratings seemed to get stronger over its first season...so I imagine that its next season will also open with a bang. (Whenever that happens post-strike.)4
Quick Notes on TV
As has been Disney’s modus operandi for a little bit, they released two high-profile TV shows in the same week, Secret Invasion and The Bear. Unlike The Bear, Secret Invasion disappointed after its launch, and we can officially start “Marvel-cession” watch for 2023 again. Compared to other Marvel debuts, Secret Invasion is solidly behind their hits—like Hawkeye and especially Loki—but up compared to some of the misses—like Ms. Marvel and She-Hulk. For example, on Samba TV, Secret Invasion had nearly a million households watch in the first five days, ahead of Ms. Marvel (775K unique viewers), but well behind Loki (2.5 million) and The Falcon and Winter Soldier(1.8 million). We’ll have a deeper dive after we get a few more weeks of data—this is a weekly-released series—but for a show rumored to cost more than $200 million, this isn’t a good enough performance.


