Sitcoms Struggle While "Ahsoka" Thrives, Plus My Problem with "Views"
The Streaming Ratings Report for 22-Sep-2023
(Welcome to my weekly streaming ratings report, the single best guide to what is popular in streaming TV and what isn’t. I’m the Entertainment Strategy Guy, a former streaming executive who now analyzes business strategy in the entertainment industry. If you were forwarded this email, please subscribe to get these insights each week.)
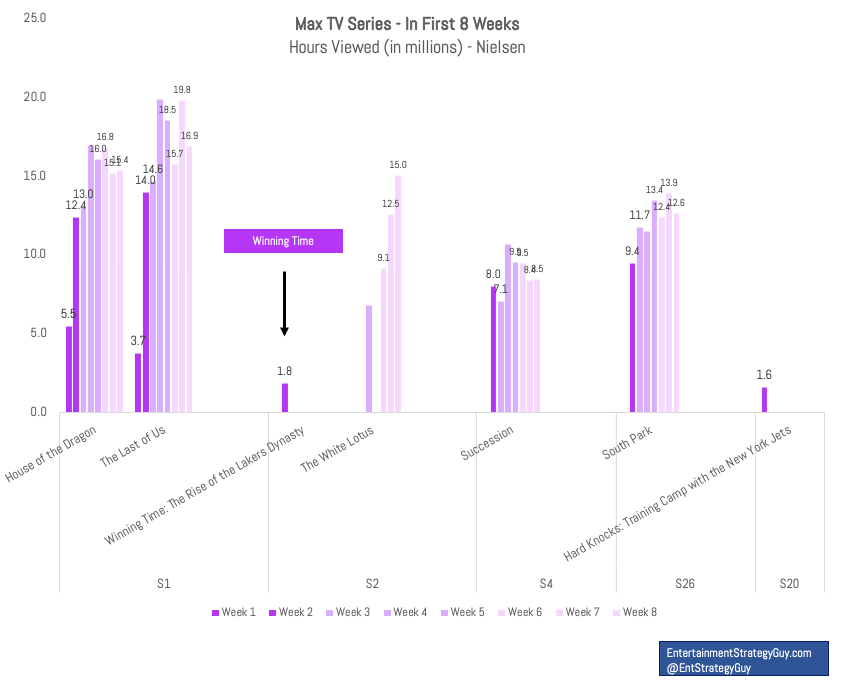
Before we get into the last two weeks of streaming ratings— I took last week off since it’s been so light, but check out my piece on the renewals and cancellations of the summer so far—I want to pat myself on the back just a bit for my call on Winning Time.
I noted two weeks ago that Winning Time missed the acquired charts, and Nielsen provided me with its hours viewed anyways, which was a pretty miserable 1.8 million hours. But I didn’t visualize it. Thankfully, Daniel Chin at The Ringer interviewed me to get some insights on it, and I went ahead and made this chart for them:
This is also a good reminder to all reporters and journalists out there that if you also would like to ask me some questions about streaming ratings, a recent TV show that got cancelled, or the trends in the streaming wars, hit me up!
Since we have a double issue this week, let’s dive right in, looking at the emergence of Disney’s new views metric (for Ahsoka), the challenge of launching sitcoms on streaming, a four-way streaming film showdown, Nielsen’s latest The Gauge with three different ways to look at it, over 30 graphs and charts, and a whole lot more.
(Reminder: The streaming ratings report focuses on the U.S. market and compiles data from Nielsen’s weekly top ten viewership ranks, Showlabs, TV Time trend data, Samba TV household viewership, company datecdotes, and Netflix hours viewed data, Google Trends, and IMDb to determine the most popular content. While most data points are current, Nielsen’s data covers the weeks of August 14th to April 27th.)
Television - Return of the Sitcoms!
Pulling together the data for the week, I noticed that a few returning series were “sitcoms” or comedies, and I naturally had a topic for my “mini-dive” on TV for this week. They were:
Solar Opposites on Hulu, on its fourth season
The Upshaws on Netflix, on its fourth season
Killing It on Peacock, on its second season
To which I would add, the Futurama came out (on Hulu in August), along with Only Murders in the Building (also on Hulu and in its third season). While not a sitcom, the latter is definitely a “haha” comedy. (As opposed to “prestige” comedies that try harder to make you cry or cringe than laugh.) So it’s time for another dive into comedies, which is something I do about every six months or so. (Back in February and March, I took a look at sitcoms, and I analyzed comedies around this time last year.)
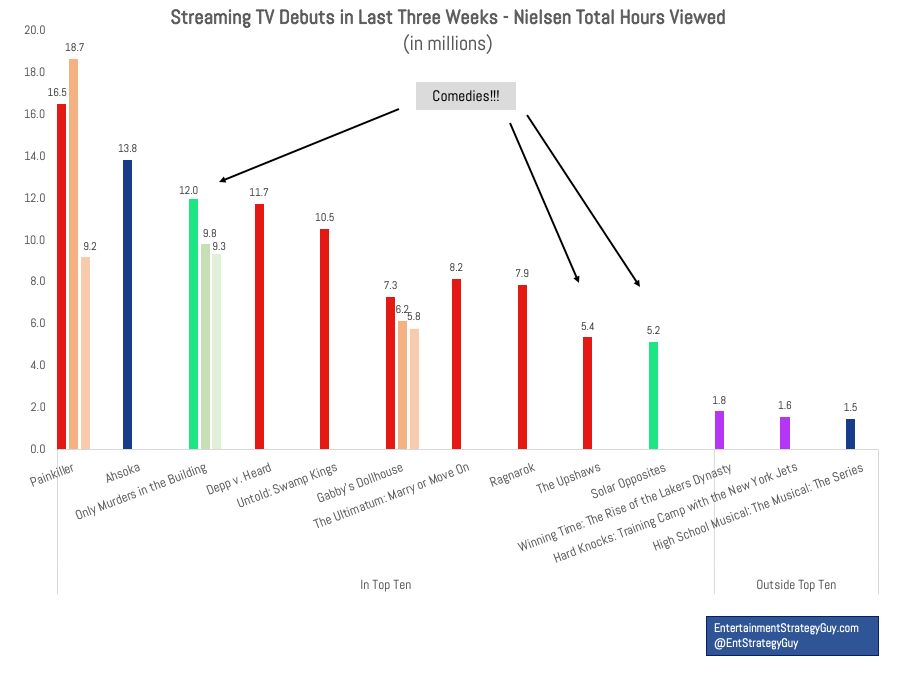
Overall, we have some slightly brighter spots in the “How well do comedies do on streaming?” question this time around. But only slightly.
The good news is that Solar Opposites and The Upshaws both made the charts this go around, the former with 5.2 million hours in its first week (then it fell off in its second week) and the latter with 5.4 million hours (then off in its second week too). Futurama showed back up too! Really, Only Murders in the Building is the big winner, debuting to 12 million hours, then having weeks with near ten million hours after that. And it’s doing that with a weekly release of one episode at a time.
Here’s the top ten “Originals” chart from Nielsen from 14-Aug:
The only trouble for comedies is that Solar Opposites and The Upshaws didn’t come close to the top of the charts.
Only getting on the charts for one week isn’t great for either show, especially since both were binge released. Meanwhile Peacock’s Killing it missed the charts entirely. It’s a big “dog not barking” this week. Taken together, I wouldn’t call any of these hits, which means that streaming still hasn’t launched a hit sitcom.
The only comfort to Hulu is that this focus on comedies paid off, at least the TV Time charts. Hulu managed to get four shows onto the TV Time charts in a single week, their highest since last July, when they also achieved one week with four titles, Only Murders in the Building, The Bear, The Orville and Solar Opposites.
But again…the caveat is that Hulu just cancelled How I Met Your Father, a show they gave a big twenty episode second season order. In general, the only sitcom/comedy of these I’d call a "true" hit is Only Murders in the Building. Futuramadid make the charts after a delay, but it also has hundreds of episodes. By the way, last issue, I forgot to include the Samba TV data point for Only Murders, where they noted that season three’s debut episode had 670K households watch in the first six days, up 14% from season two. As a reminder, the gold standard for a TV show is to build audience season-over-season.
As I’ve said before, sitcoms are a staple of the TV diet, or at least they were on broadcast and cable TV. And given the fact that both Friends and The Big Bang Theory on Max, The Office on Peacock (and formerly Netflix), Seinfeld on Netflix (and formerly Hulu), and The Simpsons on Disney+)1 are some of the most watched shows of all time on streaming, this should matter to the streamers, but launching new sitcoms really is a financial/marketing challenge streamers haven’t figured out yet. Indeed, I’d bet we see more broadcast sitcoms make their mark on streaming (like Abbot Elementary, Young Sheldon or Night Court) before a streaming-first sitcom breaks through.
Television - My Thoughts on “Views” and Ahsoka
It’s official:
“Views” are the preferred metric of the streaming wars.
Earlier this summer, Netflix added them to their global hours viewed chart. See:
Then, after the release of Ahsoka, we got this headline courtesy of Disney:
This first numerical datecdote—we've had a few leaks from Disney before about top series without numbers—from Disney foreshadows more datecdotes in the coming weeks. (We’ll cover The Little Mermaid and Elemental view counts data leaks in my upcoming issues!)
With Netflix and now Disney tacitly endorsing the “views” metric. Specifically, dividing the total hours viewed by the run-time of a show or film. I should probably explain why I mostly avoid using that data cut.
First, the name is really, really, really misleading. Other outlets call it “estimated completed views” or “complete view equivalents” or some such, and that’s even more misleading since it implies we know completion rates, or that this is a proxy for such.
Second, usually the “total hours” ranking is mostly the same as “views”, especially for films. Not always—for example a few weeks back Avatar 2 and Extraction 2—but more often than not, views and total hours tell the same story, but the former is much harder to explain.
Third, especially for weekly TV shows, the “views” metrics just doesn’t work. You would divide one week by one episode for the first week, then two episodes for the second week, then three episodes for the third and so on. Charting that on a graph, it makes each week’s “views” look smaller and smaller, but the total hours could be increasing.
Fourth, if a service only tracks “series” viewership, like Nielsen, the “views” metric will definitely mislead more than help. Say a new show comes out with 28 episodes and another show returns with five episodes, but it’s on a season four, so has forty episodes. Does “completed views” really help determine which show is “bigger”, or do total hours capture which show was watched more?
To be clear, this doesn’t mean using “views” is bad. I prefer calling it “viewership per adjusted hour”, or Nielsen uses “average minute audience”, and whichever name you prefer, the look can provide insights. And its proponents would argue it makes more “apples to apples” comparisons.
But it conflicts with another, very important data practices. Simpler is usually better. The more complicated you make an analysis, the harder it is to explain to people. (Honestly, many readers are probably lost at this point as I try to explain all of this.) Also, using the term “completion” implies we know “completion rates”, which we do not. Even using “views” implies the streamers are telling us how many people viewed something. If I could get over the terminology, I’d use it for films. (TV has too many issues.) But then I’d have two different metrics from Nielsen, and that would make things confusing.
I don’t think folks using “views” are wrong. Data analysis has a lot of subjective elements, and this is my preference and what I think folks should do. But if you disagree, that’s fine too.
Last point: it’s kind of crazy Netflix and Disney are releasing “views” when they know the actual accounts or memberships watching!
Netflix and Disney have this information; they’re choosing not to release it publicly.
If you want the best number for them to release, they should just release the number of “completed views”, meaning customers who watched 70% of a given show. Or provide us completion rates per show. Unlike these “views” counts, that data would genuinely provide us new information.
But Let's Not Ignore Ahsoka…
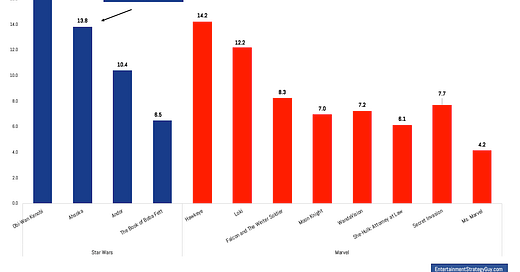
Wow, that’s a lot of data talk to finally get to Ahsoka. It had a very good launch, with 13.8 million hours in its first week. Here’s how that stacks up to other Star Wars and Marvel series…
(I put the Marvel series in red and Star Wars series in blue above.)
Ahsoka also took over the top TV Time spot, which is par for the course for Marvel and Star Wars series:
In addition, Ahsoka made the Samba TV top ten charts, and Samba TV said it had 1.2 million households watch in its first six days. The second episode had 955K in the same time period. On IMDb, it has an 8.0 on 42K reviews, which is also good for a Star Wars/Marvel/DC series.
Oh yeah, and there was that Disney datecdote that Ahsoka had 14 million views in the first five days.
(Why five days? Why not I guess? I can understand three days, since that usually includes the weekend if something launches on a Friday, and I can really understand the first seven days, since that’s a week. But five days for a show that launched on a Tuesday doesn’t even get you to Sunday…)
Until we have more datecdotes from Disney to compare, I’ll point out this is my table of top Disney datecdotes in the past, with Ahsoka as an “unknown”. Given that Disney didn’t give us any superlatives (for example, “biggest series launch since…”) we’d have to assume it didn’t crack the top ten or top five launches to date, though that does surprise me looking at the Nielsen numbers.


